
Land records, assessment & property tax · Executive summary
The Regressive Map
How geospatial analysis reveals assessment inequity in property tax — and what to do about it
For Assessors, GIS Leaders and Geographic Information Officers, CFOs and Finance Directors, County Administrators, Boards of Review and Equalization.
Asset Mapping Evidence Standard
- Sources verified
- Claims checked
- Evidence critically assessed
- Conclusions evidence-rated

GISP Continuing Education Credits
AssetMapping Intelligence reports study qualifies for GIS Certification Institute continuing education credit. Certificate of Study included with all report purchases. Visit www.gisci.org to self-submit the report curriculum for approval.
Executive summary
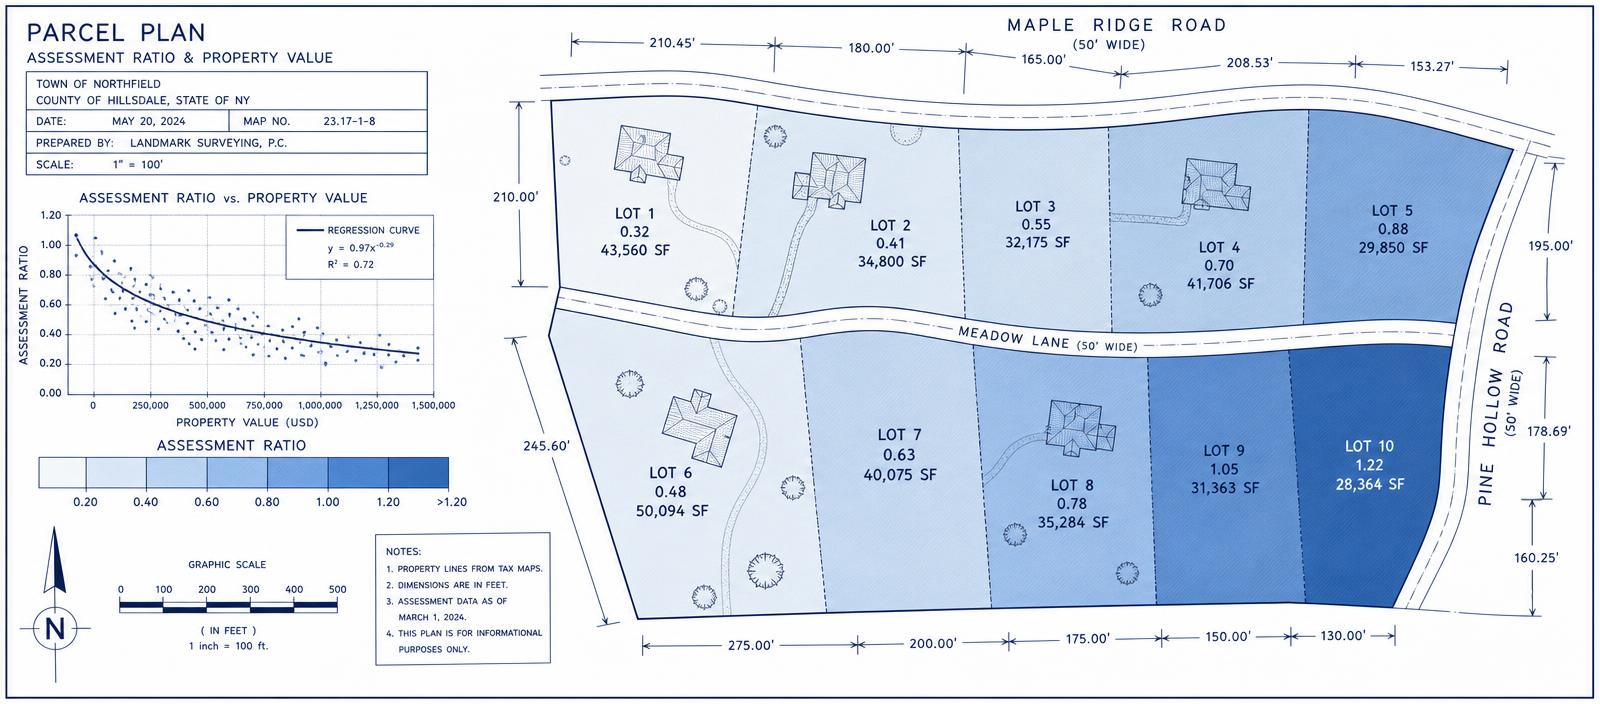
A property assessment system can appear accurate overall and still systematically over-assess lower-value homes. Nationwide research based on millions of residential transactions has found widespread evidence of this pattern — known as assessment regressivity. In the average jurisdiction studied, homes toward the bottom of the price distribution were assessed at substantially higher ratios of assessed value to market value than homes toward the top. The important question for local government is therefore not simply "are our assessments accurate?" but "are they equally accurate across property values, neighborhoods and market areas?"
Assessment inequity rarely appears as a single jurisdiction-wide number. It shows up in patterns tied to neighborhoods, market areas, property characteristics, reassessment cycles, model performance, sales data and appeal behavior — which is where geography becomes decisive. This report sets out the mechanism, the independent evidence for its scale, one documented reform (Cook County) and one contested case (Detroit), the IAAO measures that already exist (COD, PRD, PRB), and a four-quarter uniformity program a jurisdiction can start with the sales data it already holds.
Contents
- 01Executive Summary
- 02How location becomes a tax bill
- 03Five findings a leader can act on today
- 04Assessment is a spatial estimate, whether or not you treat it as one
- 05The error runs downhill
- 06The disparity often has a geography — and a demography
- 07Four reasons the tilt keeps coming back
- 08Case — Cook County, Illinois
- 09Appeals are the second regressivity engine
- 10Case — Detroit, Michigan
- 11The measures already exist
- 12Glossary — the terms, defined
- 13Five things geographic analysis actually does
- 14What unequal assessment ratios mean for two homeowners
- 15A ratio study, step by step
- 16The uniformity scorecard
- 17A four-quarter uniformity program
- 18From a roll to an accountable roll
- 19Appendix — Evidence snapshot
- 20Evidence Framework
- 21Conclusion — The map is not neutral
- 22Bibliography